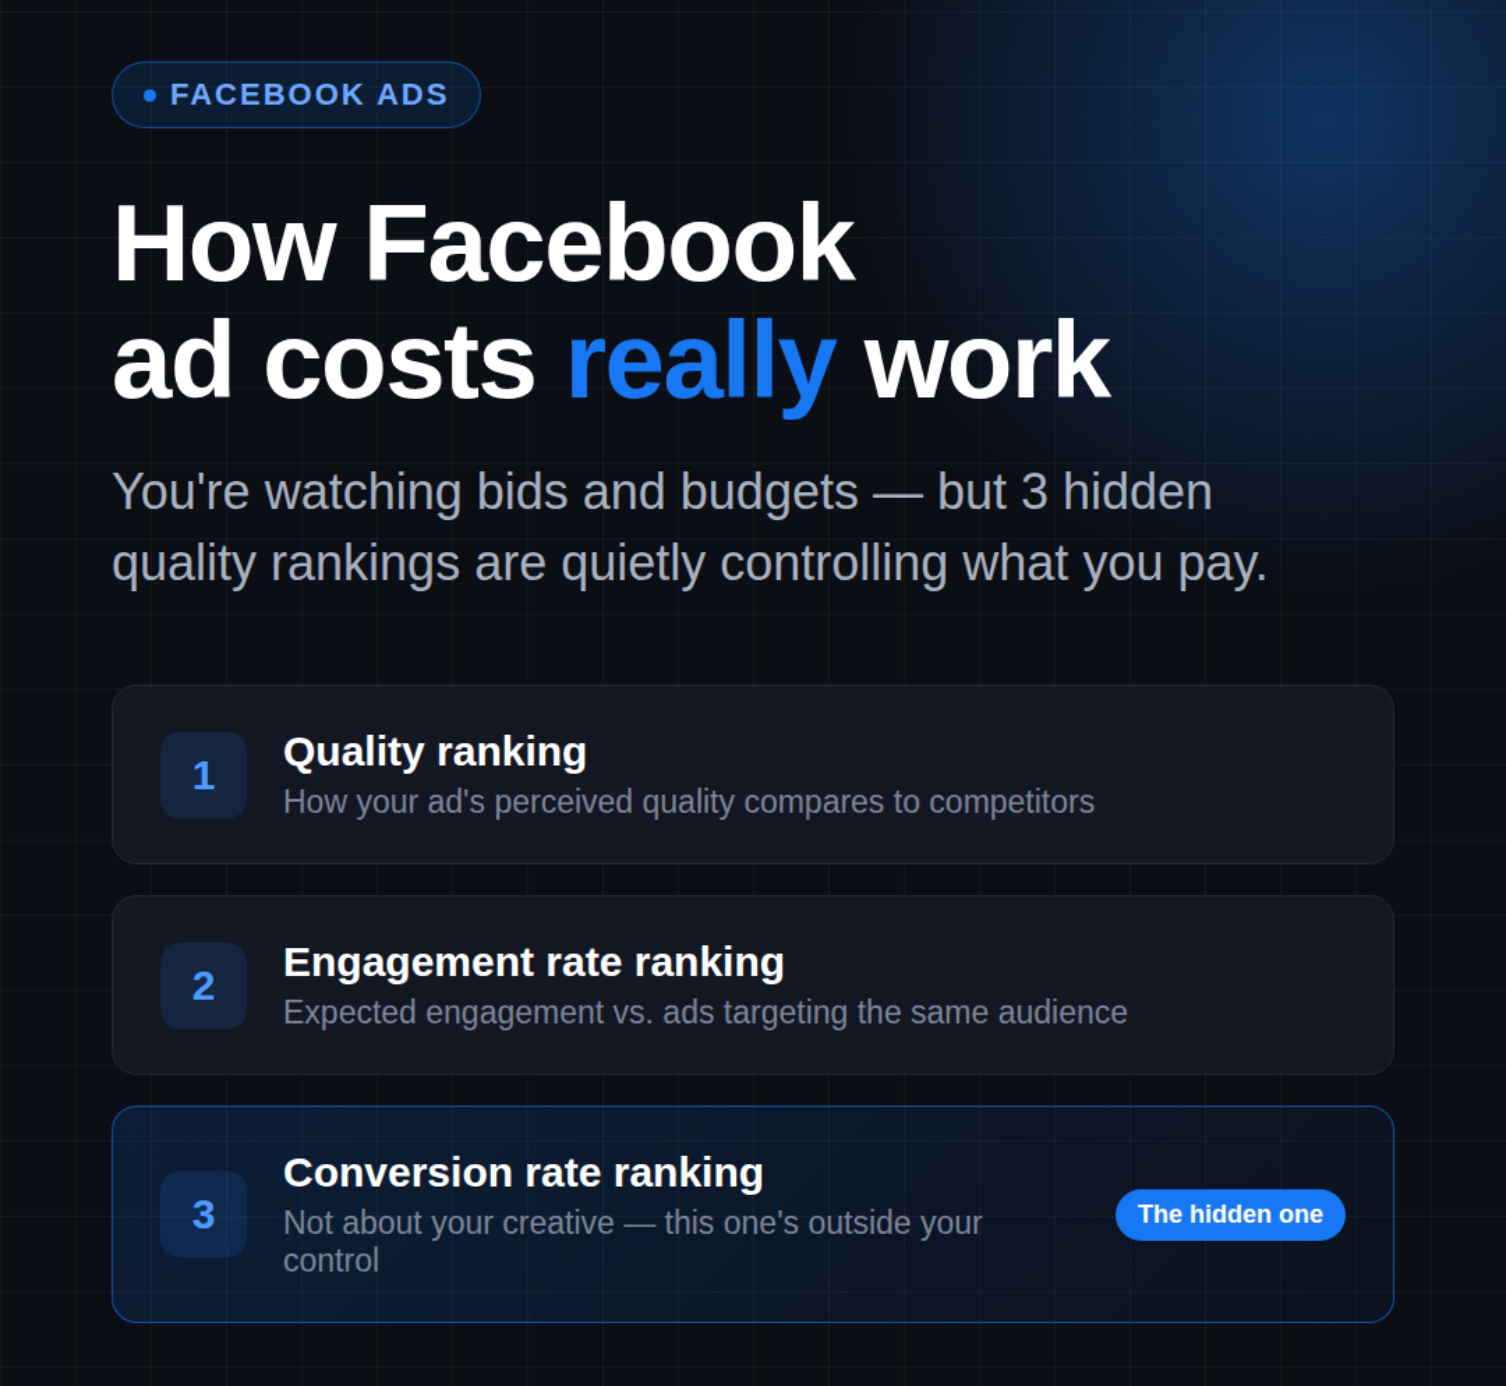
You’re probably checking your bid amounts and budget caps, but Facebook is quietly penalizing your ads through three hidden quality scores that most advertisers never open. One of them is controlled by something that has nothing to do with your creative, and it’s costing you.
Key Takeaways
- Facebook’s ad auction doesn’t just reward the highest bidder – it rewards the highest-quality ad, measured through three internal rankings most advertisers never check.
- Quality Ranking, Engagement Rate Ranking, and Conversion Rate Ranking work together to determine what you pay per result – fix all three and costs drop without touching your bid.
- Your website’s speed and post-click experience directly affect your ad quality score – a slow landing page can silently drain your entire budget.
- Understanding business economics like Average Order Value (AOV) and Customer Lifetime Value (LTV) changes how aggressively you can bid – and how fast you can scale.
- Keep reading to see which of the three rankings is hardest to fix – and why it’s where most advertisers leave the most money on the table.
Most advertisers assume the fix for high Facebook ad costs is a bigger budget or a better-looking creative. The real answer is usually hiding in three columns inside Ads Manager that most people have never opened. Once those rankings are understood, the entire economics of running Facebook ads starts to make a lot more sense.
Your Bid Isn’t What’s Killing Your Ad Budget
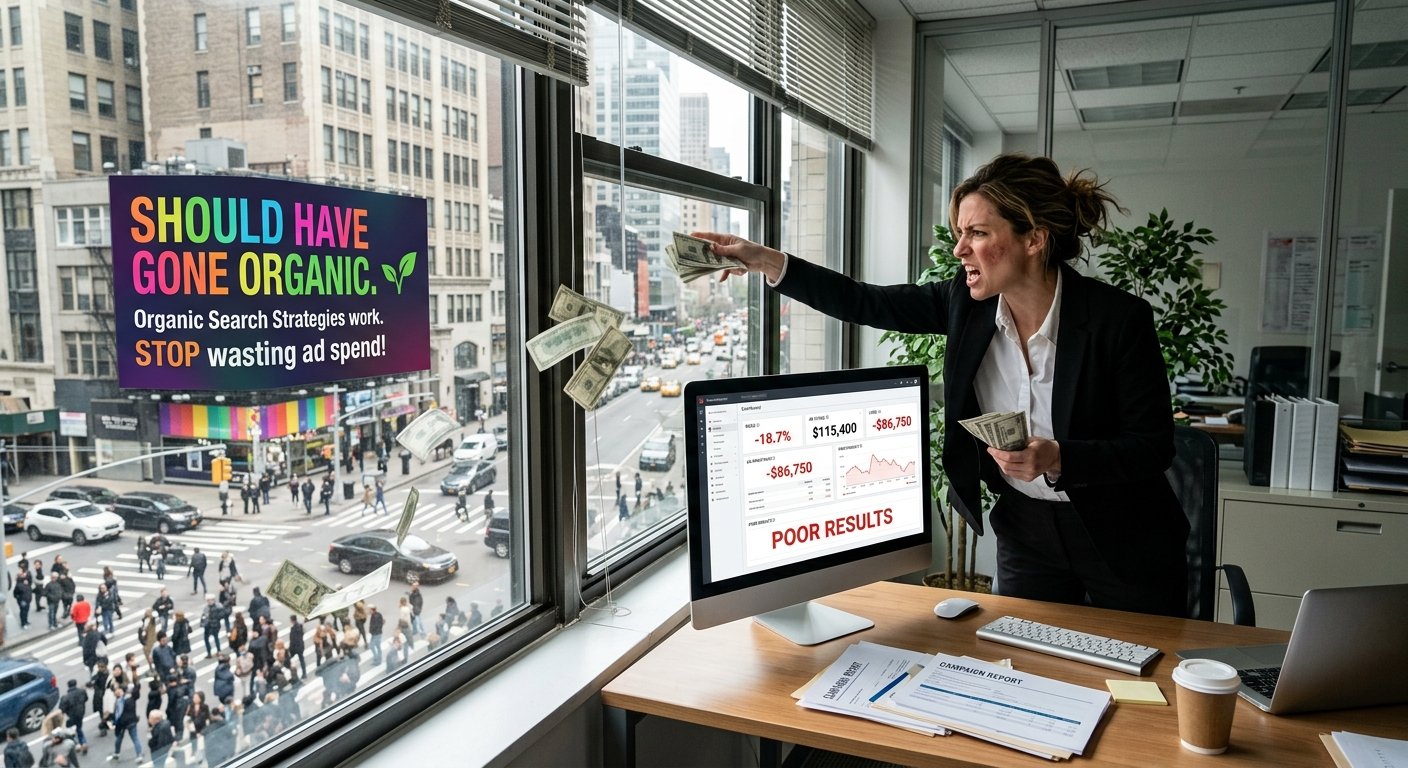
The Facebook ad auction isn’t a simple highest-bidder-wins system. Meta runs a value-based auction – meaning your ad competes not just on what you’re willing to pay, but on how useful, relevant, and engaging your ad is expected to be for the person seeing it. Two advertisers targeting the exact same audience can pay vastly different CPMs based entirely on ad quality, not budget size.
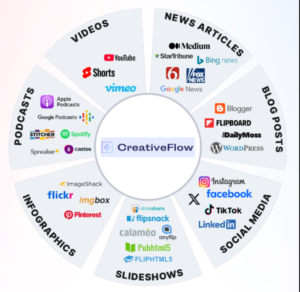
A lot of small businesses and newer advertisers get stuck here. They keep increasing spend trying to muscle their way into more impressions, when the actual problem is that Facebook has quietly decided their ads aren’t worth showing. The good news: this is fixable without spending more. Fredette Creative Media centers its Creative Flow approach around exactly this – understanding the internal signals Facebook uses and optimizing toward them strategically, rather than throwing more budget at underperforming campaigns.
The 3 Rankings Facebook Uses to Price Your Ads
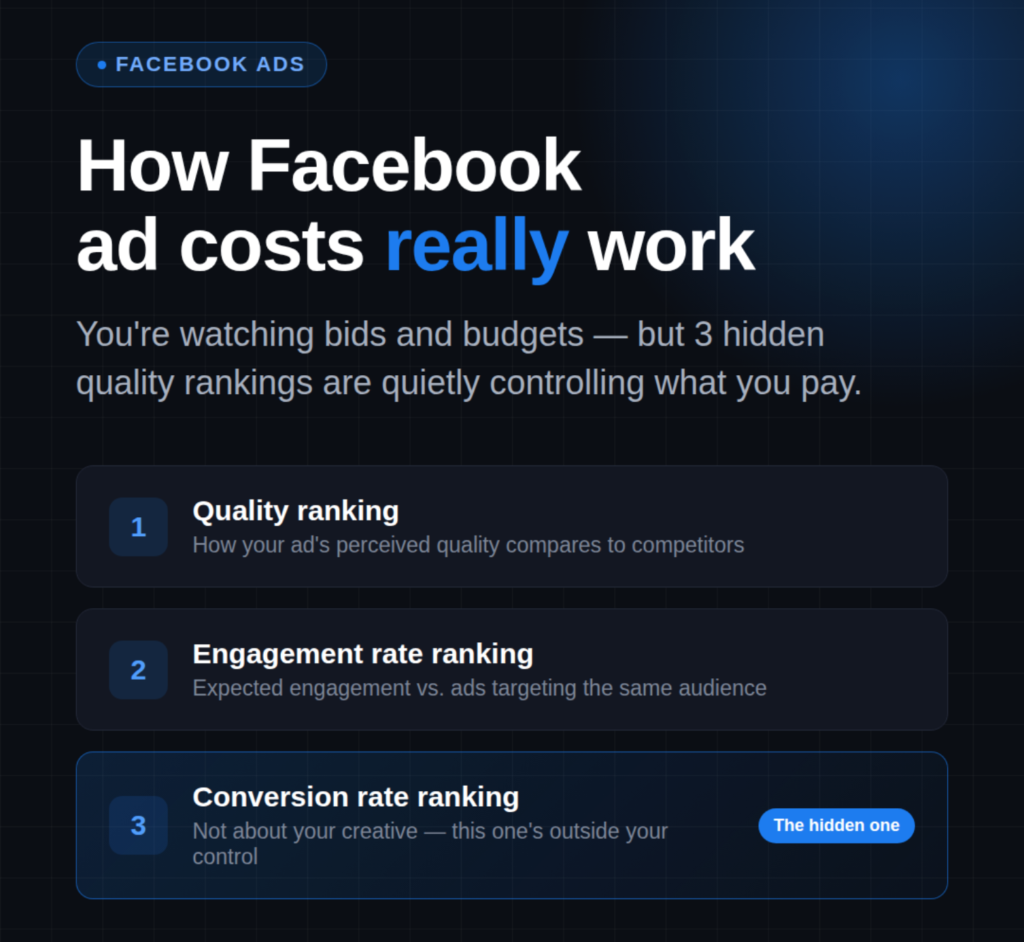
Inside Meta Ads Manager, at the ad level, there are three diagnostic columns that reveal exactly how Facebook sees your ad. They’re easy to add through Customize Columns, then search for ranking. Those three metrics are:
- Quality Ranking
- Engagement Rate Ranking
- Conversion Rate Ranking
Each one is benchmarked against other ads competing for the same audience. An ad rated Above Average across all three gets a preferred discount from Facebook – lower CPMs, better reach, and stronger overall results. An ad rated Below Average on even one metric pays a premium for every impression.
Quality Ranking: Beyond the Creative
Quality Ranking measures the perceived quality of your ad – but quality here means more than a polished visual. Facebook factors in negative feedback signals like users hiding or reporting the ad, and the post-click experience on your landing page. That second part catches most advertisers off guard. If users click through to a slow, confusing, or mismatched website and bounce immediately, Facebook registers that as a poor experience – and your Quality Ranking takes the hit, not just your bounce rate.
A low Quality Ranking leads directly to higher CPMs and reduced reach, because the platform deprioritizes ads that its users tend to dislike or disengage from quickly.
Engagement Rate Ranking: The Virality Signal
Engagement Rate Ranking measures how likely your audience is to interact with your ad – through clicks, likes, comments, and shares – compared to other ads targeting that same audience. This ranking rewards content people actually want to stop and respond to, not just passively view.
Shares carry extra weight here. When someone shares your ad, organic reach layers on top of paid reach, driving up click-through rates and signaling to Facebook that the ad is delivering real value. Ads with strong Engagement Rate Rankings see lower costs per click and get served more aggressively at lower CPMs – and that compounds quickly.
Conversion Rate Ranking: The Bottom-Line Metric
Conversion Rate Ranking reflects how likely your ad is to result in a conversion – a purchase, lead, sign-up, or other defined objective – compared to competing ads for the same audience. For direct-response advertisers, this is the ranking that most tightly correlates with actual business results.
Improving your website’s ability to convert visitors has a direct upstream effect on your ad costs. Facebook connects the dots between your ad and the outcome, so a landing page that converts well improves this ranking over time – and a page that doesn’t convert tanks it.
Why Your Website Is a Hidden Ad Cost Driver
Most advertisers treat their website and their ads as separate problems. Facebook doesn’t see it that way. The post-click experience is baked directly into the Quality Ranking and indirectly shapes the Conversion Rate Ranking – meaning your website is actively influencing what you pay per impression, even when your ads look great.
Page Speed and Mobile Experience
A website that takes more than a few seconds to load on mobile is a silent budget leak. Users bounce before the page renders, Facebook records the poor experience, and your Quality Ranking drops. AdEspresso’s research and case studies have shown that optimizing landing page experience – including clear calls to action and faster load times – significantly improves conversion rates and reduces cost per conversion for Facebook campaigns.
The fix doesn’t have to be a full redesign. Compressing images, using a fast theme (especially on Shopify), and reducing redirect chains can meaningfully improve load times. Sites like Commerce Cream are often referenced as an inspiration gallery showcasing well-designed, professional e-commerce sites – a useful reference point when assessing layout, structure, and brand presentation.
Matching the Ad to the Landing Page
The other major website issue is a mismatch between what the ad promises and what the landing page delivers. Sending someone who clicked a specific product ad to a homepage or collection page creates friction and signals a disjointed experience. Link directly to the most relevant product page, structured to give the user everything they need to convert – without hunting for it. Meta’s own guidance consistently emphasizes that relevant creative, a positive landing page experience, and a clear value proposition together are essential for controlling ad costs long-term.
Ad Creatives That Actually Move the Ranking Needle
The Engagement Rate Ranking is the one most directly shaped by creative decisions. What gets people to stop scrolling, click, comment, and share? Not always the most polished ad – often it’s the most unexpected one.
UGC and Native-Looking Content
User-generated content (UGC) and native-style ads often outperform highly produced creative in terms of engagement on social platforms. They blend into the feed. When content looks like something a real person posted rather than a brand ad, people watch longer, engage more, and share more often. For brands without an established audience or social proof, this style of creative builds trust faster than traditional ad formats. A good example is the text-overlay or notes-app screenshot format – something that reads like an organic post or a message between friends.
Memes, Trends, and Scroll-Stopping Formats
Meme-style ads are another high-engagement format worth testing, especially for brands that can tie a trending format to their product in a clever or funny way. A well-executed meme ad can generate significant shares and comments organically, driving down effective CPM while boosting the Engagement Rate Ranking at the same time. Spending time on Instagram and Facebook to spot formats that are already getting traction – then finding a clever way to connect them to your product – is a practical starting point for this kind of creative.
Business Economics: AOV and LTV as Bidding Tools
There’s a ceiling to how much any of the above helps if the underlying business economics don’t support profitable ad spend. This is where many small businesses hit a wall – not because the ads are bad, but because the margins don’t leave enough room to compete.
AOV and LTV Change What You Can Afford to Bid
Average Order Value (AOV) and Customer Lifetime Value (LTV) directly determine the maximum cost-per-acquisition that keeps a campaign profitable. A business with a $139 AOV and no repeat purchase behavior has a very different bidding ceiling than one with a $180 AOV and a $250 LTV. The numbers aren’t just accounting – they define how aggressively an advertiser can bid, which affects auction competitiveness and, by extension, reach.
Running the math through a paid ad scaling calculator – inputting AOV, LTV, cost of goods, conversion rate, and cost per click – gives a clear picture of break-even ROAS and forecasted profitability at different spend levels. Small improvements compound quickly: raising AOV through bundles or upsells, improving site conversion rate by even half a percent, reducing cost of goods sold. The business that understands these numbers can scale confidently; the one that doesn’t keeps guessing.
Fix All Three Rankings, Pay Less Per Result
Quality Ranking, Engagement Rate Ranking, and Conversion Rate Ranking aren’t separate problems to solve in isolation – they’re interconnected signals that together determine your standing in Facebook’s auction. A fast, well-matched landing page improves Quality and Conversion Rankings. Authentic, engaging creative lifts the Engagement Rate Ranking. Sound business economics create the profit headroom to keep bidding competitively. When all three are working, Facebook rewards the advertiser with lower CPMs, better placement, and more efficient spend – without any increase in budget.
The fix isn’t always dramatic. Sometimes it’s a faster page load. Sometimes it’s swapping a polished product photo for a UGC-style video. Sometimes it’s adding a bundle to raise AOV. But it always starts with pulling up those three ranking columns and knowing what they’re telling you.
For small business owners and digital marketers looking to go deeper on ad performance strategy, Fredette Creative Media offers hands-on creative and media expertise built around making paid traffic actually work for your business.